Gnuplot Mode
Introduction
Gnuplot is an extremely useful program — it's fast, easy to use and great for getting a look at your data before starting a more sophisticated analysis. You can run gnuplot interactively at a command prompt, but I generally find it easier to write a plot script instead.
In order to edit these scripts a little more comfortably, I wrote this
major mode for emacs. It offers syntax hilighting and basic
indentation, as well as a command to plot the file. You can run the
plot command either directly (by M-x gnuplot-run-buffer), or with
the (customizable) shortcut C-c C-c.
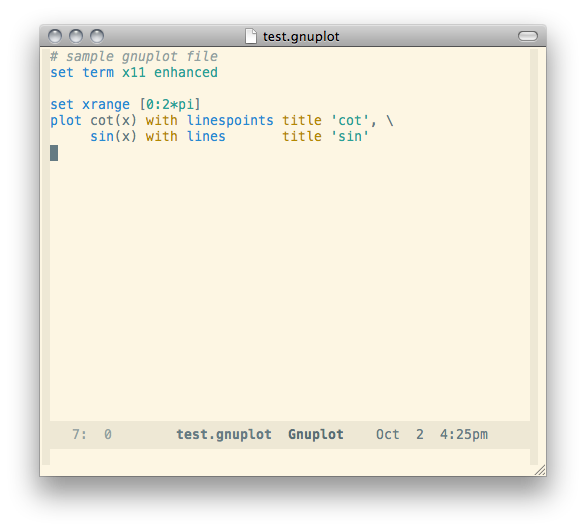
Here is a screenshot showing the basic syntax hilighting. Note that it warns you about spaces at the ends of lines, which cause gnuplot to crash, but are otherwise hard to spot.

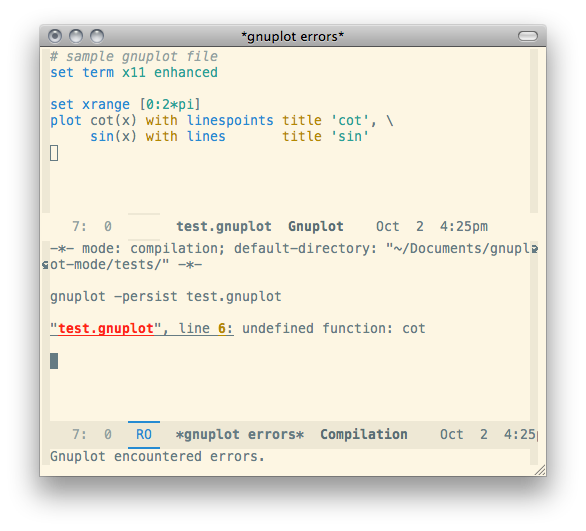
The mode runs gnuplot entirely in the background. If gnuplot reports an error, it creates a buffer called “gnuplot errors” and brings it to the front to show you what happened.

This uses the emacs compile system, so commands like next-error
and previous-error will work as expected.
You can also send commands to gnuplot using C-c C-b (send buffer to
gnuplot) or C-c C-r (send region to gnuplot), but the error
reporting isn't as helpful with these functions.
This mode was insipired by the one written by Bruce Ravel (available here), but I think it's much simpler to use — it runs gnuplot non-interactively, and only has one command to remember.
Installation
If you like, you can download the file
here. Once this file is
somewhere visible to emacs, you can add the following to your .emacs
to make it work.
;; make sure file is visible to emacs (if needed)
(add-to-list 'load-path "/path/to/your/lisp/files")

;; load the file
(require 'gnuplot-mode)

;; specify the gnuplot executable (if other than /usr/bin/gnuplot)
(setq gnuplot-program "/sw/bin/gnuplot")

;; automatically open files ending with .gp or .gnuplot in gnuplot mode
(setq auto-mode-alist
(append '(("\\.\\(gp\\|gnuplot\\)$" . gnuplot-mode)) auto-mode-alist))
Better yet, use MELPA! If you add MELPA to your package archives
using the following, you can install gnuplot mode with a simple M-x
package-install gnuplot-mode.
(require 'package)
(add-to-list 'package-archives
             '("melpa" . "http://melpa.milkbox.net/packages/") t)
I hope you find this useful. Please let me know if you encounter any problems with the mode, or if you have any suggestions for improving it.
