Research
Projects
Introduction

This page gives a quick overview of some of the research I’ve worked on. If you want less detail, check out my figure gallery or the “word cloud” visualization of my papers above; if you want more detail, you can browse my publications here.
Do Galaxy Clusters Boil?
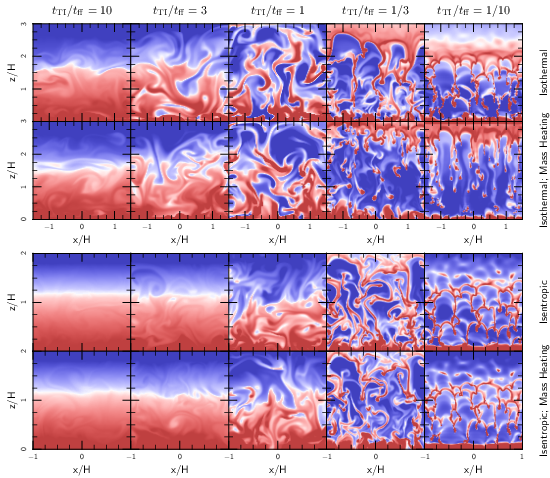
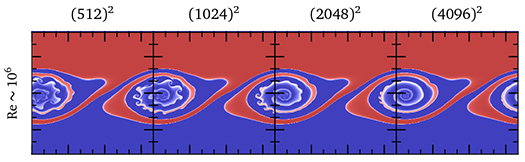
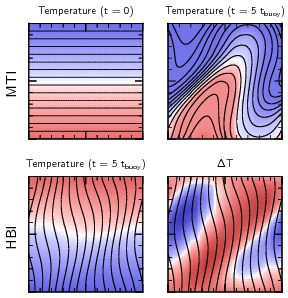 Galaxy clusters are filled with a hot, magnetized plasma that’s
surprisingly thermally conductive. This makes the gas susceptible to
two recently-discovered instabilities known as the HBI and the MTI
(pictured to the left). These instabilities are a lot like normal
convection, but they depend on temperature instead
of entropy. It turns out that the gas in galaxy clusters is
stable to the classical theory for convection, but unstable to
these new instabilities.
Galaxy clusters are filled with a hot, magnetized plasma that’s
surprisingly thermally conductive. This makes the gas susceptible to
two recently-discovered instabilities known as the HBI and the MTI
(pictured to the left). These instabilities are a lot like normal
convection, but they depend on temperature instead
of entropy. It turns out that the gas in galaxy clusters is
stable to the classical theory for convection, but unstable to
these new instabilities.
Why’s this interesting? Clusters have long been assumed to be convectively stable, but it now seems that the intracluster plasma boils vigorously. This boiling represents a radical change in the dynamics of cluster gas, and could affect the way we interpret observations of galaxy clusters. Convection efficiently mixes the gas and would distribute metals more efficiently through the cluster. Boiling also drives turbulence, which influences the connection between gas pressure and gravity used to infer the masses of clusters, and thus to constrain things like dark energy.
I’ve worked on understanding the differences between the HBI and the MTI, and on understanding their non-linear saturation. Since the linear phases are so short-lived, understanding the non-linear behavior of the instabilities is essential for knowing their astrophysical implications.
The HBI: an instability seeking stability
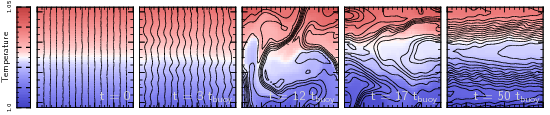
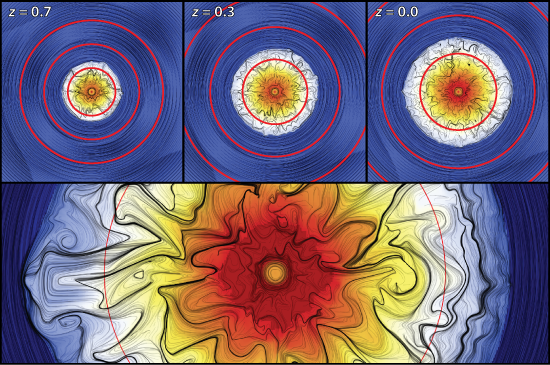
The HBI, pictured below, turns out to be a fairly quiescent instability. As the instability grows, it reorients magnetic field lines to be preferentially horizontal. This stabilizes the gas against the HBI, so the instability effectively shuts itself off before it really develops. We end up with a stable atmosphere, without much turbulence, and with very horizontal magnetic field lines. This happens when the temperature increases with radius, as in the centers of cool-core galaxy clusters.
The MTI: boiling away
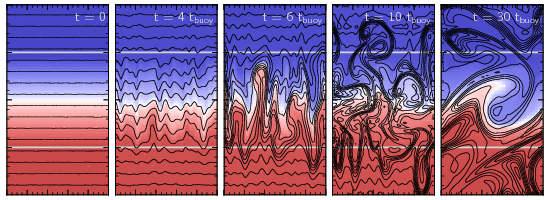
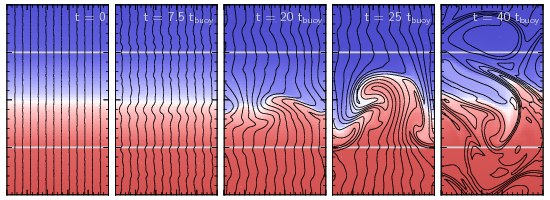
The MTI occurs in the outer parts of galaxy clusters, where the temperature declines with radius. In many ways, this instability is similar to the HBI: it creates buoyant plumes which rake out the magnetic field lines, reorienting an initially horizontal field to become predominantly vertical. This is where the similarity with the HBI stops, however: while vertical field lines are linearly stable to the MTI, they are non-linearly unstable (i.e., they become unstable if given a big enough push). So the MTI can’t shut itself off as efficiently as the HBI; it continues to grow and can eventually drive vigorous convection.
What’s next?
The simulations depicted above are idealized and are only intended to highlight the basic physics of these new forms of convection. I’m currently working on a method to study the instabilities in a more realistic environment resembling a forming galaxy cluster. I’ve included a figure from a preliminary simulation below. This is a work in progress… stay tuned!
Gas Clouds in the Galactic Center
Disruption by shear instabilities
There’s a gas cloud (“G2”) in the galactic center which has received lots of attention lately because its radial orbit brings it close to the black hole in the center of our galaxy. Several research groups have modeled this cloud using hydrodynamic simulations, which don’t include the effect of magnetic fields. These studies consistently find that the cloud quickly breaks apart as it moves through the background gas in the galactic center. This result can only be reconciled with observations if G2 formed quite recently, or if there is less gas in the galactic center than we expected.
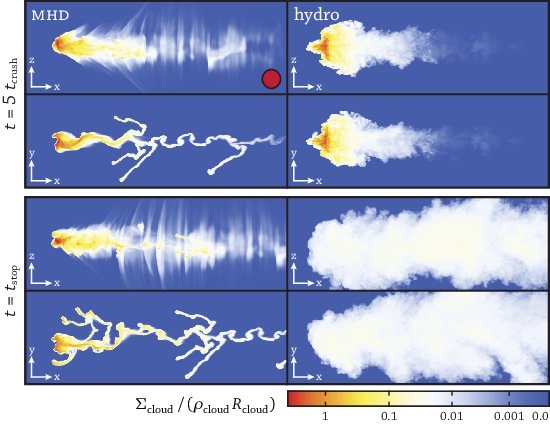
I showed that magnetic fields can significantly slow the disruption of gas clouds like G2, enabling them to live longer than was found in earlier simulations. The figure below compares a hydro simulation (right) with an MHD simulation (left). While the cloud completely disintegrates in the hydro simulation, it stays intact when I include magnetic fields. This result could relieve some of the tension between our theories of the galactic center and simulations of G2.
Using G2 to probe the galactic center accretion flow
Much of the excitement about G2 stems from the idea that part of it will fall into the black hole, causing an energetic outburst. But equally exciting is the opportunity to use the gas cloud to learn about the dynamics in the galactic center: several theories predict different properties for the accretion flow feeding the black hole, but there’s currently no observational test to determine which one is right.
One result from our MHD simulations (see the previous section) is that magnetic fields can significantly amplify the drag force acting on gas clouds like G2. This is an interesting possibility because there’s a similar cloud in the galactic center (“G1”) which is on almost exactly the same orbit, but with less energy. An interesting paper by Oliver Pfuhl suggested that, if G1 and G2 started out along the same orbit, the lower energy for G1 could be the result of a drag force slowing it down.
Ann-Marie Madigan and I further explored this possibility. We found that, by modeling G2’s orbit in detail, we can begin to constrain properties of the gas in the galactic center and to test the various theories for it. Though it’s a bit speculative, we hope this will be a useful result!
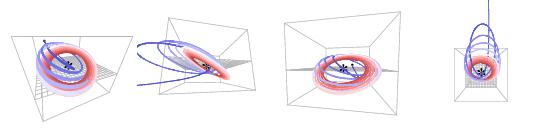
The figure below shows a few different views of our model for G2’s orbit. The gas cloud initially comes in from apocenter on a nearly radial orbit. The cloud’s orbital plane is misaligned with the rotation of the background flow; in addition to slowing the cloud down, the drag force twists its orbital plane. After about five pericenter passages, the orbital plane is aligned with the rotation axis of the accretion flow. No further twisting occurs, but the orbit circularizes and the cloud becomes approximately co-moving with the rotating gas.
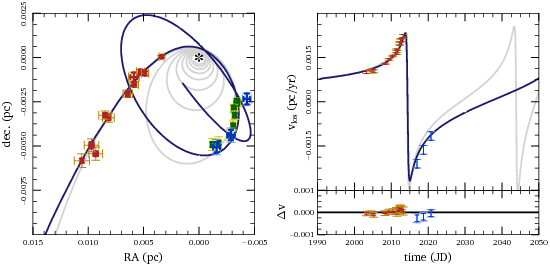
I’ll admit that the orbit above looks slightly crazy, so I want to emphasize that it is in fact consistent with the observations. The plot below shows the trajectory of the cloud in the plane of the sky, along with the astrometric measurements for G1 and G2. I also show the line-of-sight velocities determined from spectroscopy of the Br-γ line. This model does just as well as fitting G1 and G2 with two unrelated Keplerian orbits.
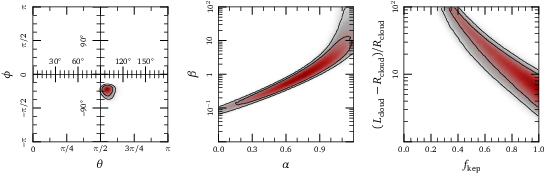
We’re almost to the point where we can use this analysis to test theories for black hole accretion. Below I show probability distributions for six parameters in the model: the angular coordinates for the rotation axis of the accretion flow, the magnetic field strength and density profile for the gas in the galactic center, the shape of the cloud, and the rotation profile for the galactic center. Already, we constrain the rotation axis quite closely, and this prediction will be tested in the next year by the Event Horizon Telescope.
The other parameters in our model are unfortunately still degenerate. For example, the magnetic field strength and the density profile both control the magnitude of the drag force; since the cloud cares only about the total strength of the drag force, we can’t determine the density or magnetic field strength individually. However, measuring the magnetic field strength by some other means would yield a constraint on the density profile — that would provide a quantitative test for theories of the accretion flow feeding the black hole in our galactic center. Similarly, measuring the shape of the cloud would yield a constraint on the rotation profile for the galactic center accretion flow — both are very exciting prospects, and Ann-Marie and I are continuing to explore them!
 In a new paper, we
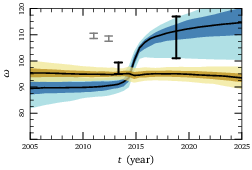
update this model to account for precession inferred in the data.
This effect is best seen in ω, the argument of pericenter. In
the figure to the right, I plot the ranges of ω evolution
predicted by our old models (yellow), and updated models (blue). The
black error bars show estimates derived from the data we try to fit.
It's a subtle effect, but we see definite improvement!
In a new paper, we
update this model to account for precession inferred in the data.
This effect is best seen in ω, the argument of pericenter. In
the figure to the right, I plot the ranges of ω evolution
predicted by our old models (yellow), and updated models (blue). The
black error bars show estimates derived from the data we try to fit.
It's a subtle effect, but we see definite improvement!
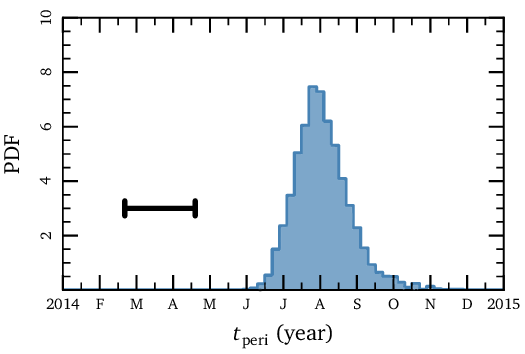
Physically, precession (or an increase in the argument of pericenter ω) corresponds to delaying cloud’s closest approach to the black hole. The plot below summarizes our finding… we find that the cloud passed the black hole in late summer of 2014, roughly 5 months after previous predictions! This delay is so significant that the pericenter passage probably happened after most of the observing campaigns monitoring G2 ended. Intriguingly, a recent paper found that the black hole began flaring significantly in August of 2014. Though any connection between G2 and activity at the event horizon seems uncertain, it's hard to ignore that this corresponds exactly with our favored pericenter passage.
Cold Gas in Hot Halos
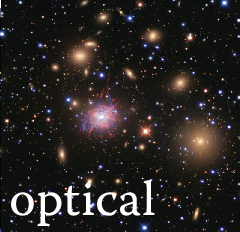
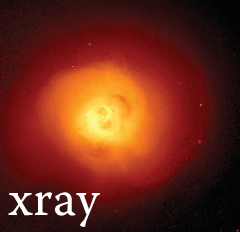
Remarkably, some galaxy clusters contain thin filaments of cold (104 K) gas embedded right within the hot (108 K) plasma. Below, the beautiful optical and x-ray images from Fabian et al. (2011) show the co-existence of these two phases of gas.
I’ve studied thermal instability in galaxy clusters and argued that it can produce filaments of cold gas like the ones observed. Whether or not the plasma in clusters is thermally unstable is a surprisingly tricky question --- it depends on the unknown “feedback” process heating the plasma, which is difficult to model in detail and is still a very active field of research. My approach was to assume that the gas is thermally unstable, then to see what other testable implications that would have for the gas in galaxy clusters.
When do we get cold gas?
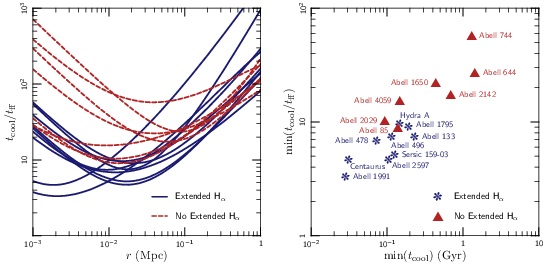
Even though I assumed that all of the plasma in every cluster is thermally unstable, it turns out that the instability only grows to large amplitudes at special locations in the cluster. We should only expect to see cold gas develop at locations where the cooling time drops below the free-fall (or dynamical) time. The plot below shows this result for various assumptions about the gas. In all cases, we only see clumps or filaments of cold gas when the cooling time is shorter than the free-fall time.
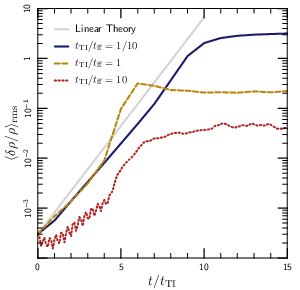 Though this result depends on the non-linear saturation of the thermal
instability, we got lucky and it’s surprisingly simple to
understand. The plot to the right tracks the growth of the
instability in my simulations. Perturbations initially grow
exponentially, which is not surprising since I put in an instability
by hand. (The slower growth for the red curve happens because the
instability switches to an overstability in that limit.) The
exponential growth can’t continue forever, however; it stops
when the damping rate due to internal gravity wave turbulence matches
the driving rate due to thermal instability. This balance picks out a
final amplitude δρ/ρ~(tcool/tff)-1.
Multi-phase gas requires δρ/ρ>1, which explains why we only see it
when tcool drops below tff.
Though this result depends on the non-linear saturation of the thermal
instability, we got lucky and it’s surprisingly simple to
understand. The plot to the right tracks the growth of the
instability in my simulations. Perturbations initially grow
exponentially, which is not surprising since I put in an instability
by hand. (The slower growth for the red curve happens because the
instability switches to an overstability in that limit.) The
exponential growth can’t continue forever, however; it stops
when the damping rate due to internal gravity wave turbulence matches
the driving rate due to thermal instability. This balance picks out a
final amplitude δρ/ρ~(tcool/tff)-1.
Multi-phase gas requires δρ/ρ>1, which explains why we only see it
when tcool drops below tff.
What can thermal instability do for you?
The figure below plots the ratio tcool/tff as a function of radius in a handful of galaxy clusters. The ones shown in blue are clusters which are known to have filaments of cold gas, while the ones shown in red are known not to contain filaments. There does seem to be a threshold in tcool/tff separating the clusters with and without multiphase gas. Interestingly, the curves all reach a minimum at a few tens of kiloparsecs; this is exactly where we see cold gas seen in many clusters!
This has implications for galaxy clusters and galaxy formation beyond identifying where the cold gas comes from. In a paper with Prateek Sharma, we argued that, since filaments of cold gas can rapidly heat the remaining gas by fueling star formation and black hole feedback, the gas in massive galaxies and galaxy clusters should self-regulate to sit near the threshold for nonlinear thermal instability. In a recent series of papers, Mark Voit and his collaborators have extended this theory and applied it to a range of observations in galaxy and cluster formation.
Why Aren’t Galaxy Clusters Isothermal?
Somehow, galaxy clusters maintain their large-scale temperature gradients in spite of thermal conduction and convection. Conduction and convection are enemies of temperature differences… they should only take a few billion years (less than the age of a typical cluster) to equilibrate and make the gas isothermal. But for some reason, clusters aren’t becoming isothermal. Since the convective stability of cluster gas depends on its temperature profile, I became very interested in this conundrum.

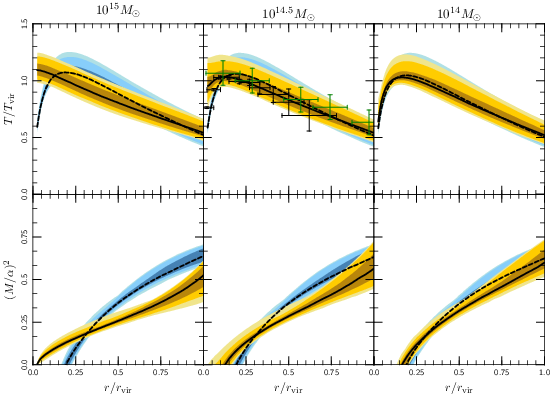
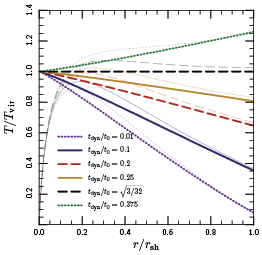 I put
together a simple model for the formation of galaxy clusters in
which the cluster assembles “shell-by-shell.” As the
cluster grows in mass, each shell falls in a little faster than the
last, and thus shocks to a higher entropy. Hydrostatic equilibrium
then determines the temperature profile, which depends directly on the
accretion rate of the cluster. The accretion rates typical for galaxy
clusters turn out to yield declining temperature profiles, similar to
what are observed. Measuring the properties of the gas in clusters
may thus provide an interesting indirect measurement of the formation
histories of clusters.
I put
together a simple model for the formation of galaxy clusters in
which the cluster assembles “shell-by-shell.” As the
cluster grows in mass, each shell falls in a little faster than the
last, and thus shocks to a higher entropy. Hydrostatic equilibrium
then determines the temperature profile, which depends directly on the
accretion rate of the cluster. The accretion rates typical for galaxy
clusters turn out to yield declining temperature profiles, similar to
what are observed. Measuring the properties of the gas in clusters
may thus provide an interesting indirect measurement of the formation
histories of clusters.
This model neatly reproduces the observed temperature profiles of galaxy clusters, but what about conduction and convection? Why don’t they wash out the temperature differences and make the gas isothermal? Conduction does indeed move thermal energy outwards in galaxy clusters. But, rather than heating the gas in the outskirts up to higher temperatures, the influx of thermal energy expands the gas — this pushes the shock further out and causes the temperature to actually go down! The overall effect is to keep the temperature gradient approximately constant.
What's next?
This method provides an inexpensive way to model the temperature profile of a galaxy cluster given its accretion history. Since the scatter in accretion histories is well-known from cosmological simulations of structure formation, I outlined a method for using the (known) scatter in accretion histories to predict the (unknown) scatter in cluster observables at fixed mass. For example, the figure below shows that variation in accretion histories leads to about a 10% scatter in temperature at fixed mass. My collaborators and I are currently using this method to better understand potential biases in some cosmological measurements.
Bending Under Pressure
The filaments I mentioned above are a lot like star-forming clouds, but they don’t live in galaxies. Some friends and I submitted an observing proposal to study star formation in these filaments and compare it to star formation in molecular clouds in galaxies. While writing that proposal, we serendipitously discovered a bent radio jet in one of the galaxies in the Perseus cluster, pictured below.
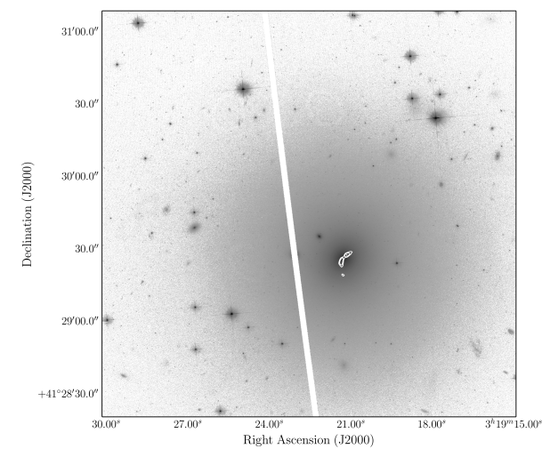
The jet is a beam of energetic particles launched by the super-massive black hole in the center of the galaxy. In this galaxy, the jet is being bent backwards by the headwind the galaxy feels as it flies through the plasma filling the galaxy cluster in which it lives.
We weren’t the first to observe this phenomenon; in fact, it’s so well known that it’s been used to discover new galaxy clusters in radio surveys. However, our galaxy is the most extreme one known to date. This jet’s bending is so severe that its radius of curvature is much smaller than the size of the galaxy. This implies that the “wind” of intracluster plasma penetrates so deep into the center of the galaxy that it affects star formation in the galaxy and even the dynamics of its central black hole! The galaxy is totally changed due to the fact that it’s inside a galaxy cluster.
Because we know how strong a headwind this galaxy feels, we can model the dynamics of the jet in a little bit of detail. We found that the standard assumption of equipartition often used in interpreting other jets underestimates the pressure in this one by a factor of almost 30.
Mixing and the Kelvin-Helmholtz Instability
A funny (and at first surprising) prediction of the fluid dynamics equations is that it’s impossible to mix different fluids. True mixing is caused by molecular diffusion, which isn’t included in the fluid equations. From a fluid dynamics standpoint, when you stir cream into your coffee, all you’re doing is folding and stretching the different layers of fluid into thinner and thinner sheets… once the sheets get microscopically thin, the fluid equations break down, diffusion takes over, and you finally mix the two liquids.
The Kelvin-Helmholtz Instability is a fluid dynamics instability which rapidly rolls up sheets of fluid, accelerating this folding-and-stretching process. This instability is an important process in fluid dynamics, and it crops up almost everywhere you look: in meteorology, oceanography, engineering, and astrophysics. It’s definitely something we want to make sure we can simulate accurately.
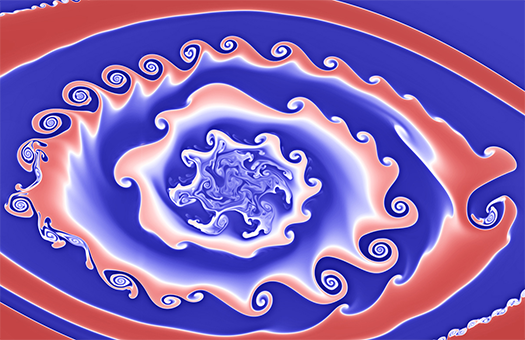
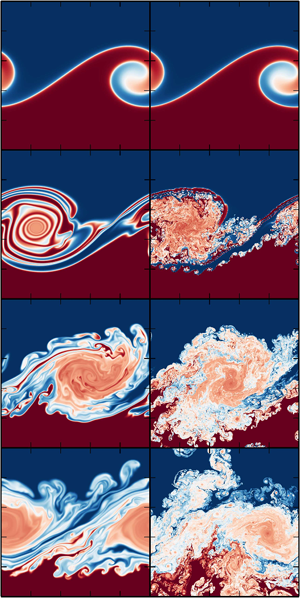
High-resolution simulations of the Kelvin-Helmholtz instability develop a beautiful, almost fractal-like structure of swirls within swirls. The small-scale swirls accelerate mixing and play a role in the development of turbulence. Scientists highlight this effect to showcase their new codes, assuming fine features signal a high-fidelity numerical solution… The only problem is that many of these features may not be real!
An important feature of the Kelvin-Helmholtz instability shown above is that it doesn't converge: there is no well-defined “answer” that a code should reproduce, and simulations with increasing resolution find increasingly discrepant solutions with more and more swirls. At a glance, you can look at a simulation and guess how modern (and how expensive) it was.
In a collaborative paper with Daniel Lecoanet and Ryan O’Leary, we study a modified version of the instability. We carefully designed the problem so it does have a well-defined answer and then we set out to find it. We show that low-resolution, inaccurate solutions produce small-scale “swirl-within-swirl” features like I showed above. But they disappear with increasing resolution, and are totally absent in the true solution! The figure below shows the features disappearing as we push to higher resolution and to more accurate solutions:
At least in case we studied, we know these small-scale swirls aren’t real… they represent an artificial instability introduced by approximations made in the code. But we did modify the problem slightly so that it has a well-defined answer. Perhaps the small-scale features are a correct feature of the original problem?
 It’s a little tricky to answer that question. Since the
unmodified problem doesn’t have a solution, we can’t say
how close we are to that solution. So I’m not convinced
it’s meaningful to discuss what’s real in the old problem.
It’s a little tricky to answer that question. Since the
unmodified problem doesn’t have a solution, we can’t say
how close we are to that solution. So I’m not convinced
it’s meaningful to discuss what’s real in the old problem.
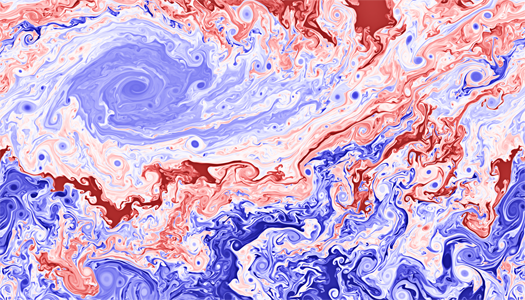
We do, however, present a few lines of evidence that what we did is more likely to be physically meaningful. One is shown in the two simulations to the left. This compares one of our new simulations (left column) with a very high-resolution simulation without any diffusion (right column). Time increases as you move down the columns.
In the first image in this section, I showed that simulations with no dissipation produce an intricate, “swirl-within-swirl” structure. When we push to absurdly high resolution, as shown in the right column, we’d naively expect to find very accurate solutions, with very little mixing. Instead, we find tons of tiny instabilities which grow incredibly quickly and shred apart the main vortex. These instabilities are numerical in origin, and no matter how big we make our simulation the instabilities grow in the smallest scales available, which cannot be calculated accurately by the code.
This is perhaps the most unexpected result from our work: we show that including diffusion in our simulations provides a very effective way to reduce reduce mixing in astrophysical simulations. Even if the diffusion we add is unrealistically large due to computational constraints, it’s worse to add none at all. Predictable mixing we intentionally put into our simulations is better than the unpredictable (and very often violent) mixing due to numeric errors in the method.
Diffusion is funny in fluid dynamics, though, and even a vanishingly small amount of dissipation leads to different results than none at all. This has come up more than once in well-known paradoxes in fluid dynamics.
These features are beautiful, though… if they're not real, it’s kind of a shame.
Minor Planets in our Outer Solar System
Pluto was famously stripped of its status as a planet after it became clear that there are many Pluto-like things in the outskirts of our solar system. In addition to highlighting the sociological curiosity that people can get very worked up over what we decide to name things, these Pluto-like-planets have some unexpected and interesting properties.
As more and more minor planets are discovered, it’s becoming clear that their orbits aren’t randomly distributed… the orbits all have high inclinations, tilting them out of the plane of our solar system. Even more bizarrely, they all tilt in the same way, such that the orbits make a cone-shape. The figure below sketches the orbits of these minor planets:
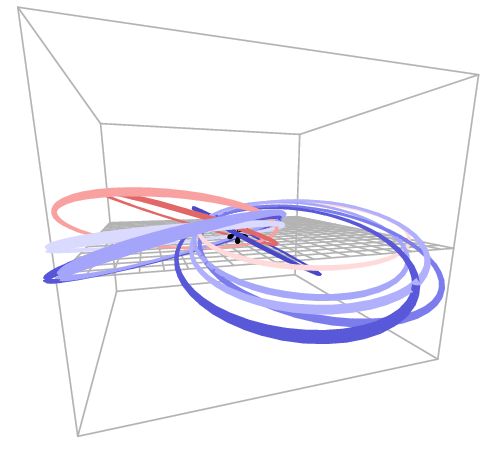
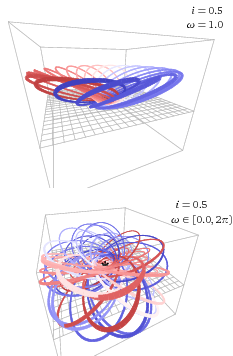 In the language of observational astronomers, “tilting in the
same way” means that the minor planets have similar values for
the argument of pericenter, called ω. The diagram to the right
shows what this means. In the top panel, I give every orbit the same
value for ω; these orbits trace out a cone. In the bottom panel
I give every orbit a random value for ω; these orbits fill out a
doughnut-shape or a “thick disk.”
In the language of observational astronomers, “tilting in the
same way” means that the minor planets have similar values for
the argument of pericenter, called ω. The diagram to the right
shows what this means. In the top panel, I give every orbit the same
value for ω; these orbits trace out a cone. In the bottom panel
I give every orbit a random value for ω; these orbits fill out a
doughnut-shape or a “thick disk.”
So the minor planets aren’t randomly distributed in ω, as we would ordinarily expect. Instead, they all have the same value for ω, giving them the structure we see. Why this should be the case, and who told them all to have this particular ω are still a mystery.
One proposal is that our solar system has an additional, undiscovered Neptune-sized planet whose gravity corrals these Pluto-like-things into the funny orbits we find them in. This explanation is an exciting possibility, and it would be great to learn we have a new planet in our solar system! But the idea also seems a little ad hoc… the good news is it’s very testable and we should find out soon whether it’s right!
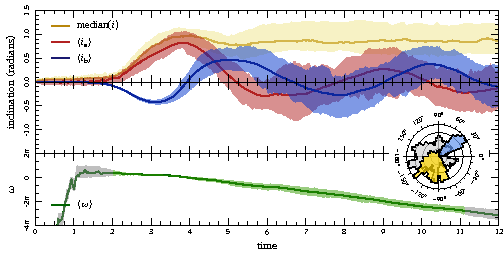
I’ve worked on another idea, proposed by Ann-Marie Madigan. Ann-Marie identified a new gravitational instability in disks of bodies like we see in the outer solar system. The effect of her instability is to drive exponential growth in inclination, as well as strong clustering in ω… the result is strikingly similar to what we see in the minor planet data for our solar system!
In this idea, the minor planets aren’t on these funny orbits because someone put them there; rather, they behave collectively and spontaneously assemble into something like this. We see them clustered into this funny shape because it would be impossible for them not to be so.
Our paper outlines Ann-Marie’s proposal and discusses some observational tests. We’re still working out some details with the specific application to the solar system… there’s more to come soon!
